The Safety Performance Management regulations supports the Highway Safety Improvement Program (HSIP) and requires State Departments of Transportation (DOTs) and Metropolitan Planning Organizations (MPOs) to establish Safety targets for five performance measures.
1. Number of fatalities
2. Rate of fatalities per 100 million Vehicle Miles Traveled (VMT)
3. Number of serious injuries
4. Rate of serious injuries per 100 million VMT
5. Number of non-motorized fatalities and non-motorized serious injuries
When do MPOs establish Safety Targets?
When establishing Safety targets MPOs may support the state’s targets, or establish their own quantifiable target for the metropolitan planning area. States establish Safety targets and report them for the upcoming calendar year in their HSIP Annual Report that is due August 31 each year. MPOs must establish Safety targets within 180 days of the State establishing and reporting its Annual HSIP Report, no later than February 27 of each year.
How are Safety Targets reported?
States report their Safety targets to the Federal Highway Administration annually in their HSIP report. The Jackson MPO reports its Safety targets annually to the MS Department of Transportation (MDOT).
Safety Target calculations
• 5-year rolling average: Each target is based on a 5-year rolling average
• Roads addressed: Safety targets cover all public roadways within the metropolitan planning area boundary regardless of ownership or functional classification, just as State Safety targets cover all public roads in the State.
• Data sources: A combination of national data sources and a State maintained crash dataset is used to establish Safety targets including Fatality Analysis Reporting System (FARS) and MDOT’s Safety Analysis Management System (SAMS)
Baseline Performance 2018-2022
| Fatalities | ||||||
| 2018 | 2018 | 2020 | 2021 | 2022 | 5-yr Average | |
| Mississippi | 663 | 642 | 748 | 772 | 729 | 710.8 |
| Jackson MPO | 64 | 73 | 104 | 77 | 87 | 81 |
| Fatality Rate per 100 Million VMT | ||||||
| 2018 | 2019 | 2020 | 2021 | 2022 | 5-yr Average | |
| Mississippi | 1.630 | 1.560 | 1.890 | 1.890 | 1.820 | 1.758 |
| Jackson MPO | 1.196 | 1.338 | 2.028 | 1.479 | 1.706 | 1.549 |
| Serious Injuries | ||||||
| 2018 | 2019 | 2020 | 2021 | 2022 | 5-yr Average | |
| Mississippi | 587 | 1,579 | 3,630 | 3,562 | 3,344 | 2,540.4 |
| Jackson MPO | 102 | 307 | 659 | 696 | 631 | 479 |
| Serious Injury Rate per 100 Million VMT | ||||||
| 2018 | 2019 | 2020 | 2021 | 2022 | 5-yr Average | |
| Mississippi | 1.440 | 3.840 | 9.180 | 8.630 | 8.370 | 6.292 |
| Jackson MPO | 1.905 | 5.627 | 12.849 | 13.372 | 12.373 | 9.225 |
| Non-Motorized Fatalities and Serious Injuries | ||||||
| 2018 | 2019 | 2020 | 2021 | 2022 | 5-yr Average | |
| Mississippi | 144 | 182 | 322 | 290 | 290 | 245.6 |
| Jackson MPO | 18 | 17 | 60 | 62 | 49 | 41.2 |
Fatality data taken from Mississippi Department of Public Safety crash records.
2024 Safety Targets Source: Fatality Analysis Reporting System (FARS) and MS Department of Transportation’s (MDOT) Safety Analysis Management System (SAMS)
On February 14, 2024 the Jackson MPO Metropolitan Planning Policy Committee voted to support the State of Mississippi’s efforts to achieve the 2024 Safety Performance Targets outlined in the MS Highway Safety Improvement Program 2023 Annual Report.
| 2024 Mississippi Safety Targets | |
| Measure | Target |
| Number of Fatalities | 711 |
| Rate of Fatalities per 100 Million VMT | 1.760 |
| Number of Serious Injuries | 2,520 |
| Rate of Serious Injuries per 100 Million VMT | 6.260 |
| Number of Non-motorized Fatalities and Serious Injuries | 247 |
Source: MS Highway Safety Improvement Program 2023 Annual Report
Resources
Resolution to Support the State of Mississippi 2024 Safety Targets
Jackson MPO Safety Condition Analysis
Safety Analysis Reports
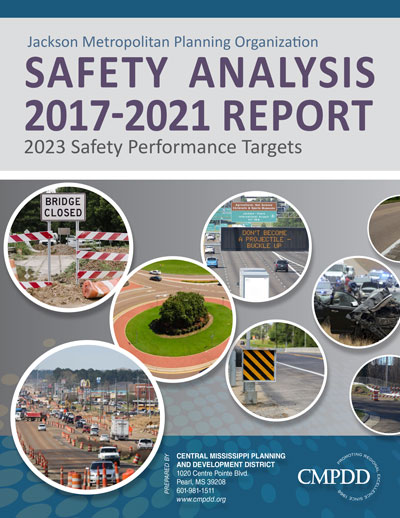
Jackson MPO 2017-2021 Safety Analysis Report
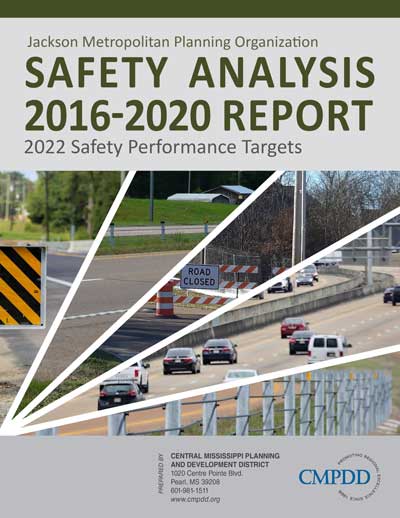
Jackson MPO 2016-2020 Safety Analysis Report
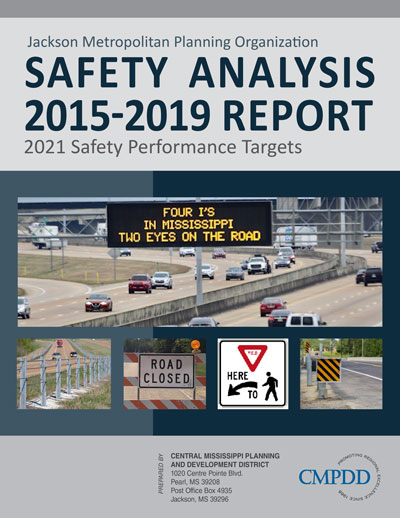
Jackson MPO 2015-2019 Safety Analysis Report
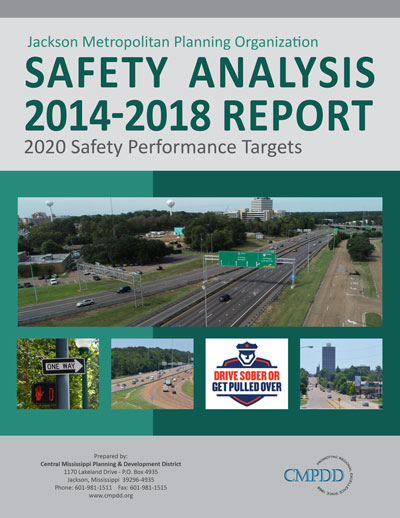
Jackson MPO 2014-2018 Safety Analysis Report
Jackson MPO 2013-2017 Safety Analysis Report
Jackson MPO 2012-2016 Safety Analysis Report
Highway Safety Improvement Program
MS Highway Safety Improvement Program 2022 Annual Report
MS Highway Safety Improvement Program 2021 Annual Report
MS Highway Safety Improvement Program 2020 Annual Report
MS Highway Safety Improvement Program 2019 Annual Report
MS Highway Safety Improvement Program 2018 Annual Report
MS Highway Safety Improvement Program 2017 Annual Report


You must be logged in to post a comment.